IC Markets Home Sign in Web Trader Contact Us
IC Markets Social IC Markets Social

Information Hub for
Serious Traders

  • ABOUT US
  • OPEN LIVE ACCOUNT
  • OPEN DEMO ACCOUNT
  • TRADE NOW
  • VISIT OUR BLOG
IC Markets Social
  • ABOUT US
  • OPEN LIVE ACCOUNT
  • OPEN DEMO ACCOUNT
  • TRADE NOW
  • VISIT OUR BLOG
July 26, 2022North_American_Stocks_esIC Markets

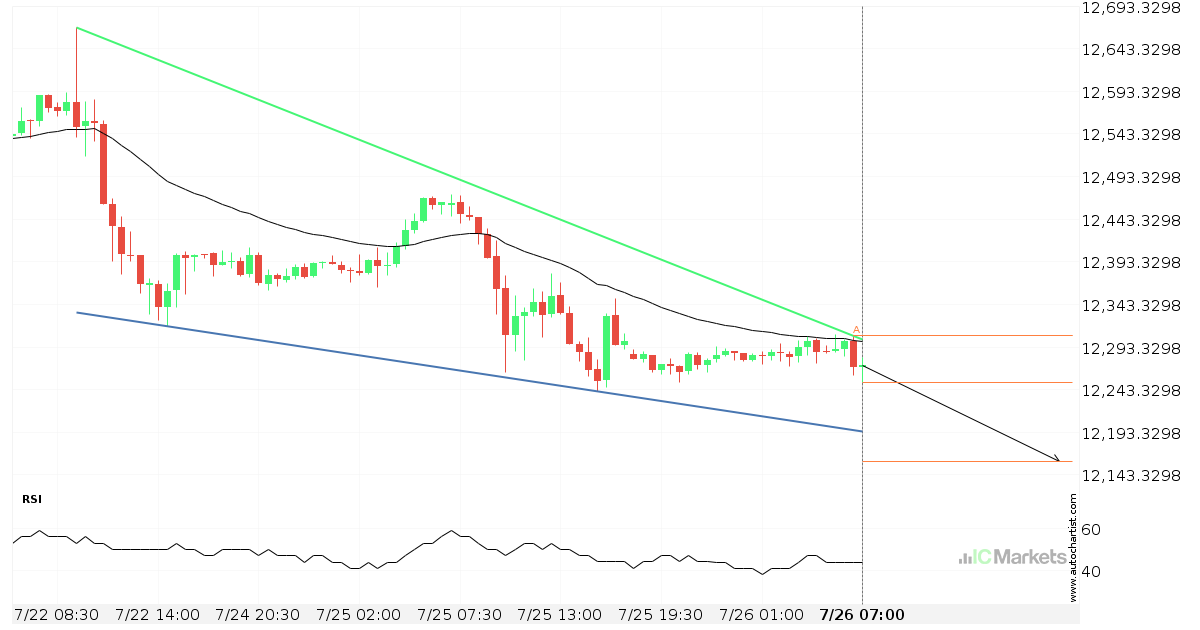
Posible ruptura del nivel de soporte en el US Tech 100 Index

El US Tech 100 Index avanza hacia la línea de soporte de un Cuña descendente, que ya ha probado varias veces en el pasado. Hemos visto un retroceso antes desde esta línea, así que en esta etapa no está claro si atravesará esta línea o se recuperará como lo ha hecho anteriormente. Si el US […]

Read more
July 25, 2022North_American_Stocks_esIC Markets

El US Tech 100 Index se aproxima a la resistencia de un Canal alcista

El US Tech 100 Index se está acercando a la línea de resistencia de un Canal alcista. Ha llegado a esta línea en numerosas ocasiones durante los últimos 11 días. Si vuelve a probarla de nuevo, debería hacerlo en las próximas 3 días.

Read more
July 22, 2022North_American_Stocks_esIC Markets

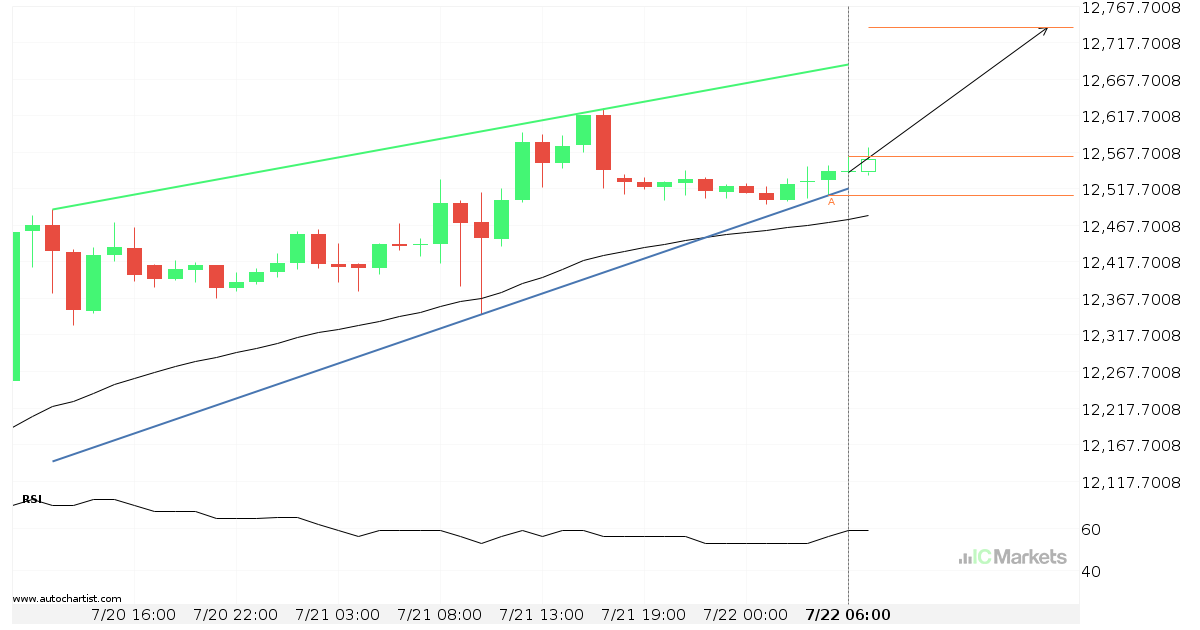
El US Tech 100 Index se aproxima a la resistencia de un Cuña ascendente

El US Tech 100 Index se está acercando a la línea de resistencia de un Cuña ascendente. Ha llegado a esta línea en numerosas ocasiones durante los últimos 2 días. Si vuelve a probarla de nuevo, debería hacerlo en las próximas 11 horas.

Read more
July 21, 2022North_American_Stocks_esIC Markets

Se espera la posibilidad de un gran movimiento en el Biogen Idec Inc

El Biogen Idec Inc ha atravesado una línea de soporte de un Cuña ascendente y sugiere un movimiento posible a 197.5032 dentro de las próximas 3 días. Ya ha probado esta línea en el pasado, por lo que deberíamos esperar la confirmación de esta irrupción antes de entrar en acción. Si dicha ruptura no se […]

Read more
July 20, 2022North_American_Stocks_esIC Markets

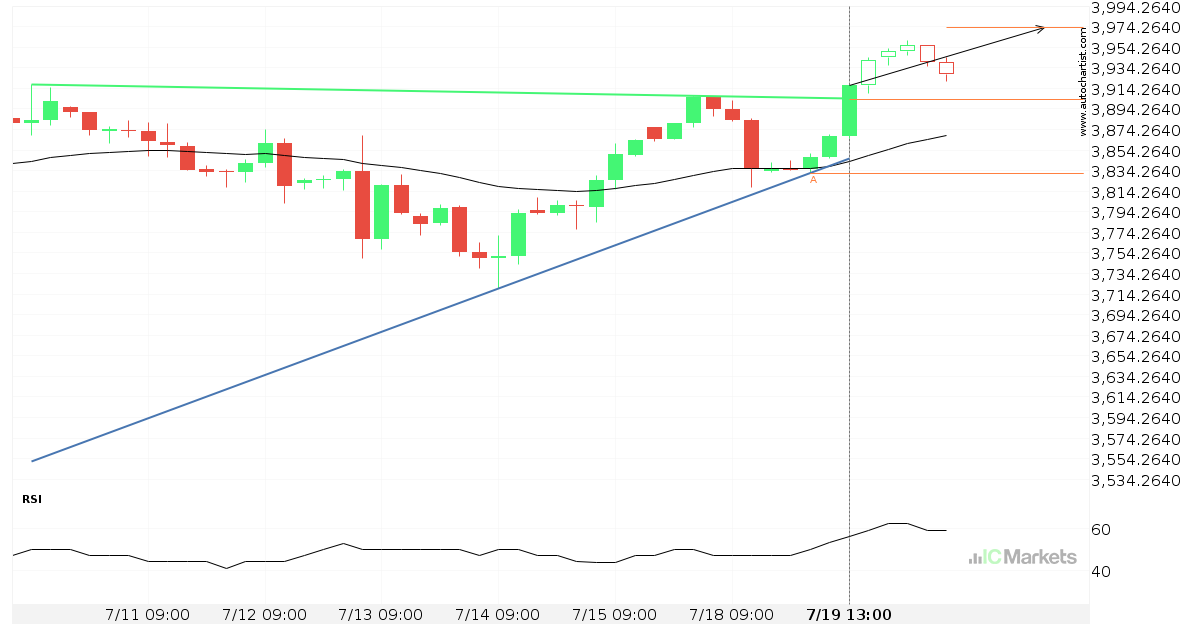
El US SPX 500 Index ha atravesado la resistencia

El US SPX 500 Index atravesó una línea de resistencia. Ha entrado en contacto con esta línea por lo menos dos veces en 12 días. Esta ruptura puede indicar un movimiento potencial a 3973.1848 en 2 días. Como ya vimos un retroceso de esta posición en el pasado, debemos esperar la confirmación de la ruptura […]

Read more
July 19, 2022North_American_Stocks_esIC Markets

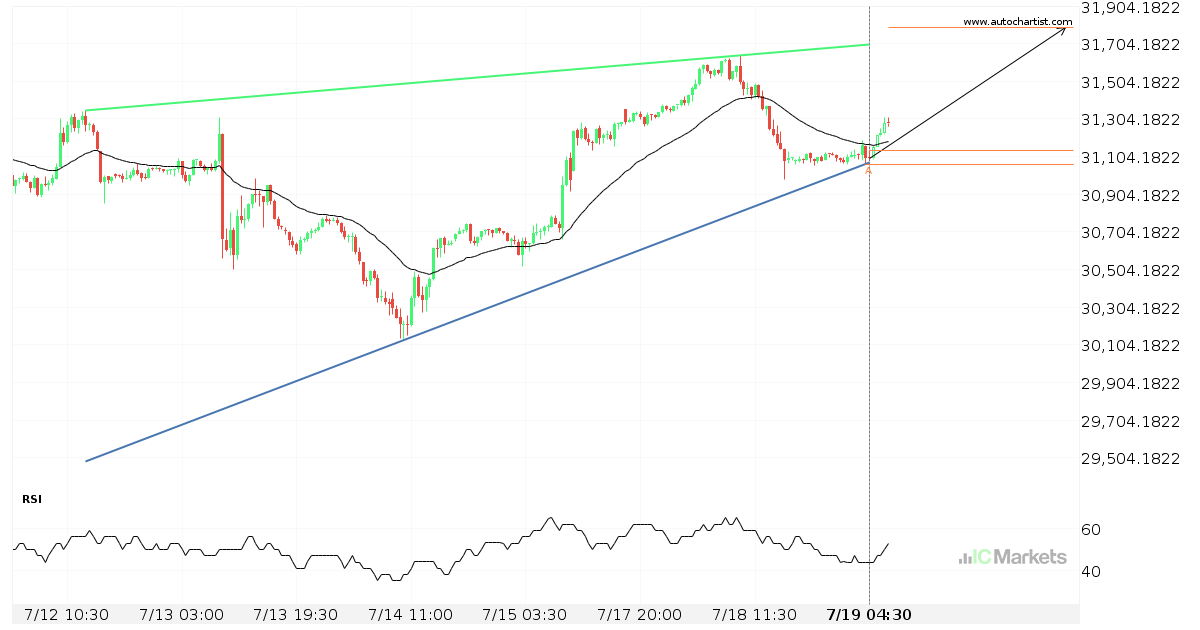
El US Wall Street 30 Index se aproxima a la resistencia de un Cuña ascendente

El US Wall Street 30 Index se está acercando a la línea de resistencia de un Cuña ascendente. Ha llegado a esta línea en numerosas ocasiones durante los últimos 7 días. Si vuelve a probarla de nuevo, debería hacerlo en las próximas 2 días.

Read more
July 18, 2022North_American_Stocks_esIC Markets

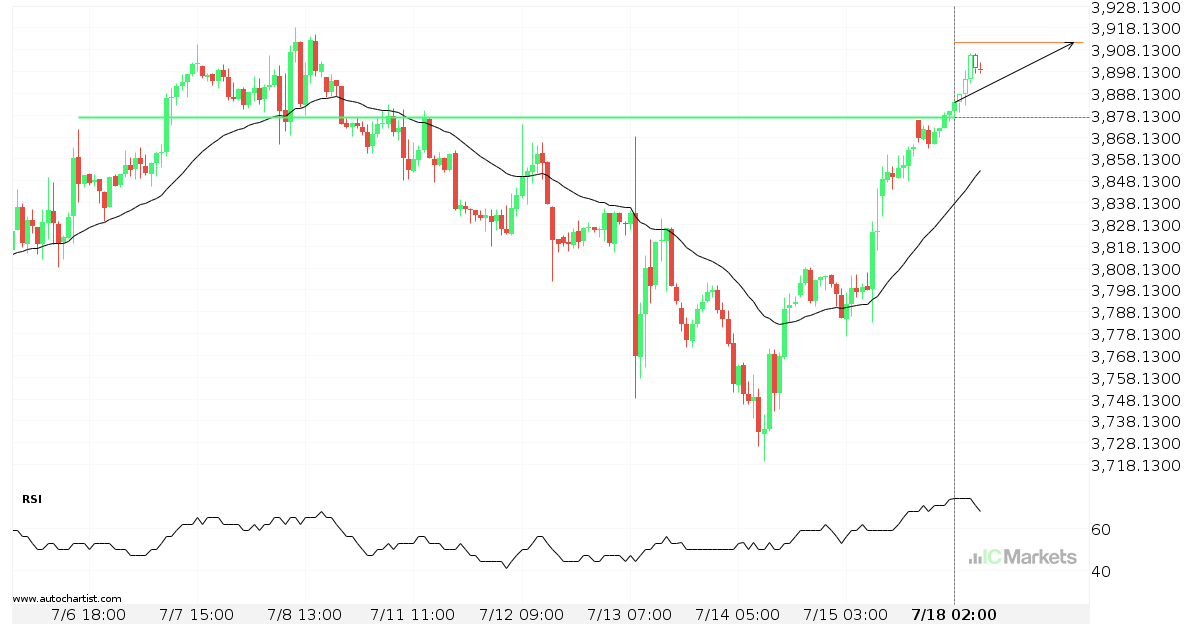
US SPX 500 Index – línea de precio psicológico atravesada

El US SPX 500 Index atravesó la línea de resistencia. Como ya lo hemos visto retroceder desde esta posición en el pasado, deberíamos esperar la confirmación de la ruptura antes de operar. Ha llegado a esta línea en numerosas ocasiones en los últimos 12 días, lo cual sugiere un posible nivel objetivo alrededor de 3911.4299 […]

Read more
July 15, 2022North_American_Stocks_esIC Markets

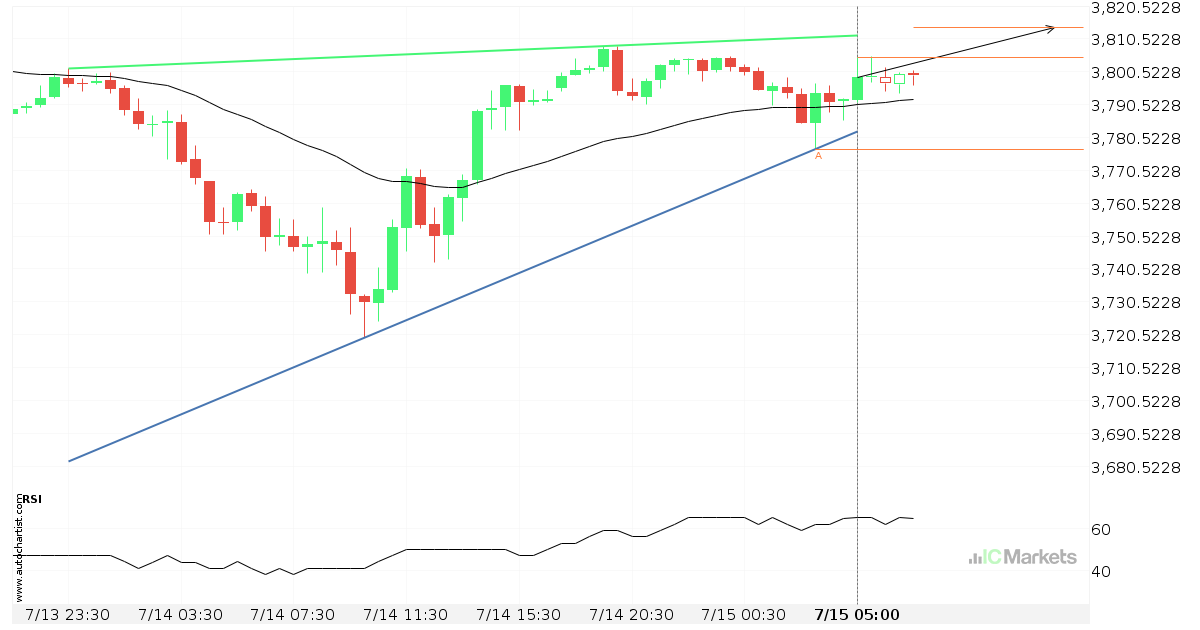
El US SPX 500 Index se aproxima a la resistencia de un Cuña ascendente

El US SPX 500 Index se está acercando a la línea de resistencia de un Cuña ascendente. Ha llegado a esta línea en numerosas ocasiones durante los últimos 2 días. Si vuelve a probarla de nuevo, debería hacerlo en las próximas 7 horas.

Read more
July 14, 2022North_American_Stocks_esIC Markets

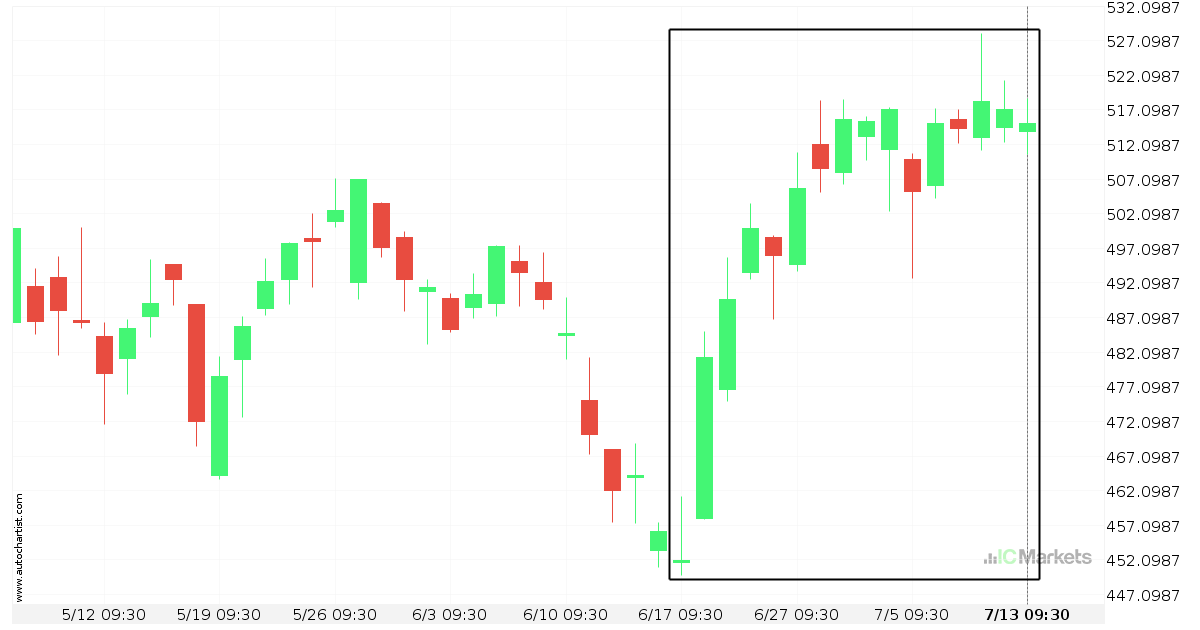
Extraordinario movimiento alcista del Unitedhealth Group Inc.

El Unitedhealth Group Inc. ha ascendido un 13,99% de 451.58 a 515.2 en 27 días.

Read more
July 13, 2022North_American_Stocks_esIC Markets

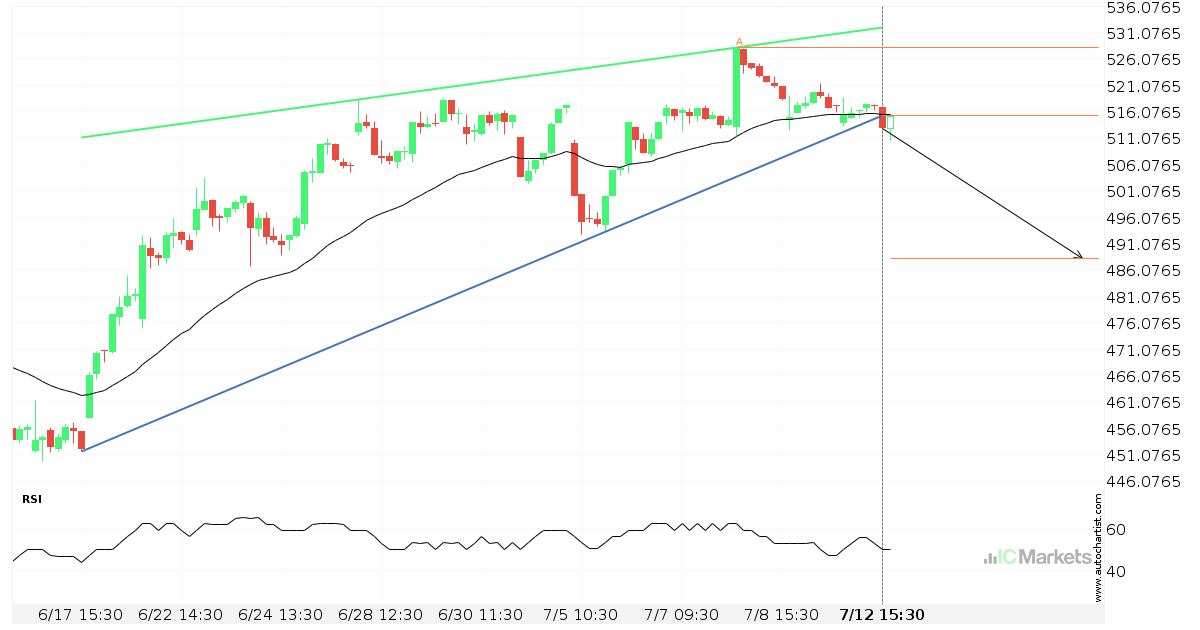
La línea de soporte ha sido irrumpida por el Unitedhealth Group Inc.

El Unitedhealth Group Inc. ha atravesado la línea de soporte, que ya se ha probado dos veces en el pasado. Hemos visto, anteriormente, un retroceso desde esta posición, así que debemos esperar la confirmación de la ruptura antes de operar. Si esta nueva tendencia persiste, un nivel objetivo alrededor de 488.3110 podría materializarse dentro de […]

Read more
  • 1
  • 2
  • 3
  • …
  • 53
  • 54
  • 55
  • 56
  • 57
  • 58
  • 59
  • …
  • 89
  • 90
  • 91

Recent Posts

  • Japan 225 Index approaching resistance level
  • Hong Kong 50 Index – Continuation Chart Pattern – Channel Up
  • AUDJPY – Continuation Chart Pattern – Channel Up
  • Australia 200 Index short term bullish trade setup to 8615.4004
  • Australia 200 Index short term bullish trade setup to 8615.4004

Recent Comments

    Translation


     Edit Translation

    Trade with

    a market leader you can rely on

    Open Trading Account Try a Free Demo

    Forex Trading

    • Accounts Overview
    • Open an Account
    • Launch Web Trader

    Trading Specifications

    • Spreads and Commissions
    • Range of Market
    • Trading Hours
    • Funding
    • Withdrawal

    About IC Markets

    • Help Center
    • Why IC Markets
    • Regulation
    • Legal Documents
    • Contact Us


    Forex Trading

    • Accounts Overview
    • Open an Account
    • Launch Web Trader

    Trading Specifications

    • Spreads and Commissions
    • Range of Market
    • Trading Hours
    • Funding
    • Withdrawal

    About IC Markets

    • Chat with a Specialist 24/7
    • Why IC Markets
    • Regulation
    • Legal Documents
    • Contact Us

    Disclaimer: This material is marketing material where all marketing material is published for informational purposes only. This material does not contain and should not be considered as containing - investment advice and recommendations, or suggestions for performing any actions with financial instruments. The built-in widgets belong to their external independent authors, and IC Markets is not responsible for their content and their impact on trade.

    All content rights reserved. Opinions of the authors may not coincide with the opinion of the blog editors. When copying materials from this site or connecting to an RSS feed to republish our articles, a link to IC Markets or attribution in the format ‘IC Markets Blog’ is required. For general questions, please contact the editorial office via the form on the Contact us page.

    Risk Warning: Trading Derivatives carries a high level of risk to your capital and you should only trade with money you can afford to lose. Trading Derivatives may not be suitable for all investors, so please ensure that you fully understand the risks involved and seek independent advice if necessary. A Product Disclosure Statement (PDS) should be considered before entering into a transaction with us.

    The contents of this page are general information only and does not take into account your personal situation, financial objectives or needs. It is up to you to make sure the products that we offer suit your specific needs. You should not trade with us unless you understand the features and risks of the products that we offer. This means that you might need to seek independent advice before you start trading with us.

    © 2022 Raw Trading Ltd | All rights reserved.
    • Sample Page